FX Blue Trading Simulator v3 for MT4 - User guide
The FX Blue Trading Simulator converts the MT4 strategy tester into a tool for practising manual trading using historic data. You can use the Simulator to test how well you would have fared under particular historic market conditions - and/or to check how well your favourite indicators would have guided you in the past.
1Overview of the FX Blue Trading Simulator v3
1.1Purpose of the Trading Simulator
The FX Blue Trading Simulator converts the MT4 strategy tester into a tool for practising manual trading using historic data. You can use the Simulator to test how well you would have fared under particular historic market conditions - and/or to check how well your favourite indicators would have guided you in the past.
The Simulator lets you place market and pending orders, set trailing stops, alter the s/l and t/p on orders by clicking on the chart, save complex order definitions as templates, quickly close all open orders, plus many more features which are not available as standard in MT4.
The results of a simulation can be published to the FX Blue website, giving you access to the full FX Blue reporting and analysis functionality.
1.2Licence
Unless otherwise specified in writing by FX Blue, this software is licensed for personal use only. You are not allowed to distribute it to other people, regardless of whether or not money is changing hands. You only have a licence to use the software if you, personally, downloaded it from our website.
The software is provided entirely at the user's risk, and you should check it thoroughly before deploying it on computers trading real money. FX Blue accepts no responsibility whatsoever for any loss of any kind caused by installation or use of the software.
2.1Installing the Simulator
You install the Trading Simulator by running its setup program. This will list all the copies of MT4 on your computer, and you simply click on the ones where you want to install the Simulator. If any copies of MT4 are not shown, you can add them to the list using the "Find MT4" button.
You will need to restart any copies of MT4 which are already running. MT4's Navigator list does not update until the software is restarted.
2.2MT4 settings
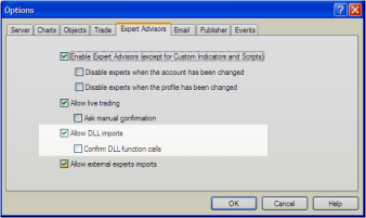
In order to use the Trading Simulator you need to turn on "Allow DLL imports". Click on Tools/Options in MT4, and then change the settings on the "Expert Advisors" tab as follows:
2.3FX Blue account
You need an account with FX Blue in order to use the Trading Simulator. You can create accounts for free at http://www.fxblue.com/live. The Trading Simulator can publish its results to the FX Blue website for further analysis. If you already use FX Blue to publish your live trading results, you may want to create a second account for use with the Simulator so that publication of the simulated results does not overwrite your live results.
3.1Starting the Simulator
You start the Trading Simulator by running a backtest in MT4 of the "FX Blue Trading Simulator" expert adviser.
- Open the MT4 strategy tester, by choosing "Strategy Tester" from the "View" menu, or by pressing Ctrl+R.
- Choose "FX Blue Trading Simulator v3" from the "Expert Advisor" list.
- Choose the symbol which you want to practise on from the "Symbol" list.
- Choose the chart timeframe which you want to practise on, from the "Period" list.
- Choose the date range which you want to practise on by clicking the "Use date" box and then choosing the start and end dates.
- Turn on the "Visual mode" setting.
- Click on the "Start" button.
For example:
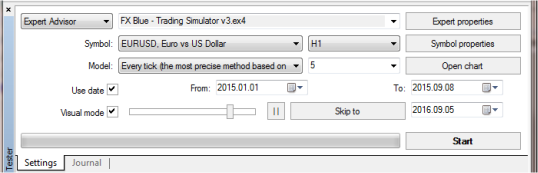
You can also control the size of the simulated account which you are trading by clicking on the "Expert properties" button and changing the "Initial deposit" value on the "Testing" tab.
Once you click on "Start", MT4 will collect the historic data for your chosen dates, and then load the Trading Simulator.
The simulation will then pause so that you can add indicators to the chart before continuing. The first time that you use the Simulator, you will need to enter your FX Blue username and password. (These details are then remembered for re-use in future.)
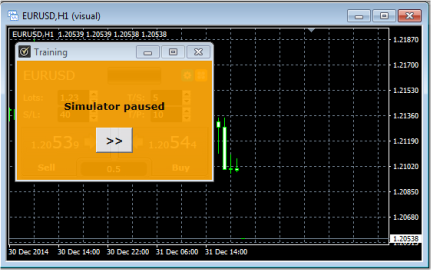
When you are ready you can start the simulation using the button in the MT4 strategy tester or the equivalent button in the Simulator itself.
For any problems in running the Simulator, please see the troubleshooting notes below.
3.2Adding indicators to the chart
You can add indicators to the simulated chart at any point, in the usual MT4 ways: double-click on an indicator in the MT4 Navigator, or drag an indicator from the Navigator onto the chart, or use the Indicators button on the MT4 toolbar. If you use "multi-timeframe" indicators, please see the note below.
3.3Controlling the speed of the Simulator
The main way of controlling the speed of the Simulator is to use the slider next to the "Visual mode" box, which has values from 1 to 32. (Once the Simulator is running, you can also change the slider using keyboard shortcuts.)
The effect of the slider depends on how powerful your computer is, how many indicators you add to the Simulator, how many ticks there are in each simulated bar, whether you are creating extra offline charts etc. As a general rule:
- Value 32 on the slider will be very, very fast.
- Values 28 to 31 will be between 10 and 20 times faster than real life (e.g. an M15 bar is simulated in 1 minute).
- Values 20 to 27 will be between 2 and 5 times faster than real life.
- Values below 10 will be approximately real-life speed (i.e. each M15 bar takes 15 minutes)
You can experiment with the slider to find the best combination for your computer and how quickly you want the simulation to run.
You can also control the speed of the simulation further using the EA's SpeedFactor property. You set this by clicking on the "Expert properties" button in the strategy tester and then altering the "Value" property on the "Inputs" tab.
The SpeedFactor parameter slows down the simulation; the larger the value, the slower the simulation. For example, you can create a simulation-speed between values 31 and 32 on the MT4 slider by setting the slider to 32 and then adjusting SpeedFactor to a non-zero value.
3.4Pausing the Simulator automatically
You can make the Simulator pause after an s/l or t/p is hit, so that you can inspect the history of the trade before continuing. You turn on this option by clicking on the "Expert properties" button in the strategy tester and then altering the "Value" property for "PauseTester" on the "Inputs" tab.
The PauseTester setting has five options:
No pausing.
Pause when s/l or t/p is hit. The simulation will pause each time that a trade is closed at its s/l or t/p.
Pause after all trade closes. The simulation will pause each time that a trade closes for any reason, including trades which you close manually. This option will also pause if a pending order expires without being filled.
Pause at the start of each bar. The simulation will pause at the start of each and every new bar. (With this option, you may want to set the strategy tester to its maximum speed. You then decide at the start of each bar whether to place a trade, and resume the simulation as a way of skipping to the start of the next bar.)
Pause at the start of each bar, and also at each trade close. This is a combination of the two options above: the simulation pauses at the start of each bar, and also at any trade-closes in the middle of bars.
4.1Placing buy/sell orders
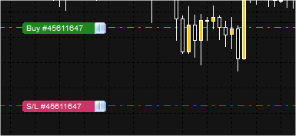
Once the simulation is running you can place buy and sell orders using the large green and red buy and sell buttons.
MT4 will show dotted horizontal lines for each order and also draw markers showing where orders were opened and closed. The status indicator at the top of the Simulator will show your current net position, e.g. +0.10 if you are long 0.1 lots, or -0.10 if you are short 0.1 lots.
You can control the lot size on new orders, and set a stop-loss, take-profit, or trailing-stop using the fields above the buy and sell buttons.
You can also open calculators for each of these fields by holding down the Ctrl key while clicking on them. For example, if you are trading 0.25 lots, and you want a stop-loss which is equivalent to $100, then you can Ctrl+click on the S/L field and tell the calculator to work out the number of pips which is equivalent to a fixed cash risk of $100.
4.2Placing pending orders
You can place pending orders (limits and stops) by clicking on the  button. You can choose the order type and entry price, stop-loss, take-profit etc.
The entry price for pending orders can be defined either as a fixed price (e.g. 1.23456) or as a number of pips. For example, if you choose a buy-limit and enter a value of 20 pips rather than a price, then the limit order is created 20 pips below the current price.
4.2.1Placing pending orders from the chart
You can also create pending orders from the chart. If you hold down the Ctrl key while clicking on the chart, a small window will pop up letting you create a pending order at the selected price. If the price you click on is above the current price then you can create a buy-stop or a sell-limit; if the selected price is below the current price then you can create a buy-limit or a sell-stop. You can turn on MT4's cross-hairs (using the button on MT4's toolbar) to show the exact price which you are selecting.
4.2.2OCO orders
The new-order form also lets you place one-cancels-other (OCO) orders. There are two types of OCO order:
- "OCO breakout". You specify two prices, or two values in pips, either side of the current price, and the Simulator places a buy-stop and a sell-stop. Once one of the pending orders is filled, the other is automatically cancelled. You would typically use this when you are expecting a major price movement, but you don't know whether the move is going to be up or down. For example, there are many trading strategies based around trading the breakout, in either direction, of yesterday's range.
- "OCO reversion". In this case the Simulator places a buy-limit and sell-limit, rather than a buy-stop and sell-stop. You would typically use this if you are expecting a move in either direction followed by a return towards the current price - e.g. a bounce off yesterday's high or low.
4.3Order templates
If there is a type of order which you place regularly - e.g. a buy-limit 20 pips below the current price, with a 100-pip s/l and t/p - then you can save this as a template for quick re-use in future:
- Click on the button
- Enter the details of the order
- Click on the "Save template" button and choose a name.
You can then quickly execute that saved template in future:
- Hold down the Ctrl key while clicking on the button
- Choose the saved template from the list
4.4Closing orders
You can close an open position by clicking on the position marker at the top of the Simulator: the text which reads +0.10, -0.50 etc. This will slide out a panel of options:
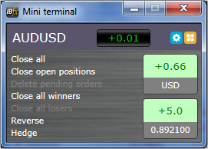
The panel shows the profitability of order for the symbol in cash terms, and also in pips. The price underneath the profit in pips is the average entry price for the position (if there is more than one open order).
You can use the options to close all open orders for the symbol, or all winning or losing trades, or to hedge or reverse the open position.
You can close individual orders by opening the account info - see below.
4.5Modifying orders
By default, the Simulator will show markers on the chart for each order. (You can turn off these markers, or change their position, using the Settings.)
You can click on the markers to open a pop-up window for each order, and you can use the "handle" at the right-hand end of the marker to drag it.
4.5.1Changing s/l, t/p and pending entry prices by dragging markers
You can change the s/l or the t/p of an order by dragging its marker, using the "handle" at the right-hand end of the marker. You can also drag the entry price of pending orders (but you cannot move the entry price of open positions!)
If you drag a marker to an invalid level - e.g. you drag a s/l the other side of the current market price - then you will be asked if you want to close the order. You can cancel a drag which is in progress by pressing the Esc key.
4.5.2Viewing and changing order details
You can open a pop-up window for each order by clicking on its chart marker. The window shows how close the s/l and t/p are to being hit (e.g. for long orders, the distance from the current bid price to the s/l), and the cash effect on the balance if the s/l or t/p is hit.
The current profit for the order shown in the top-right of the window can be switched between cash and pips by clicking on it.
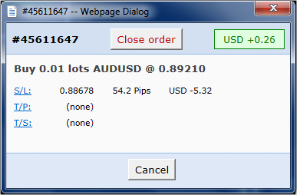
You can close the order using the red button, and you can change the s/l, t/p or trailing stop by clicking on those options.
4.5.3Changing the s/l or t/p on all open orders
You can also change the s/l or t/p on all open orders by clicking on the chart. You move the mouse over the price where you want to set the s/l or t/p (it is easier using the MT4 crosshairs), and then hold down the Ctrl key while clicking - i.e. the same method as for placing a pending order.
From the window which pops up, you then click on the s/l or t/p buttons and the s/l or t/p will automatically move to the new price selected. For example, you can Ctrl+click on the high or low of a bar to set the s/l or t/p to that price or use the cross hairs or mouse cursor to select a new price.
4.6Account info
You can view information about your simulated account using the Account Info: click on the Tools button ( ) at the top of the Simulator and then choose "Account info".
This shows your total net profit in the simulation so far, your current balance and equity, the profit on all open orders, the margin usage etc.
The account info also shows a list of all pending and open orders. You can close each one of these by clicking on the icon next to its ticket number.
5.1Overview of Smart Lines
The Smart Lines use line objects drawn on an MT4 chart as the stop-loss or take-profit for positions. They provide three main features:
Trend-line stop-loss (or take-profit)
Multiple partial stops at different prices (i.e. partial closes at different price levels)
Time-based stops (e.g. close all positions at midnight)
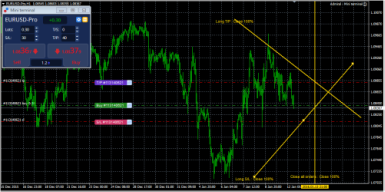
In the following example there are two converging trend-lines, one for the stop-loss and one for the take-profit. In addition, there is a time (vertical) line which will close the open position if the price has not already hit one of the trend lines by then.
5.2Creating a Smart Line
To create a Smart Line you simply do the following:
Draw a horizontal line, a vertical line, or a trend-line on the chart
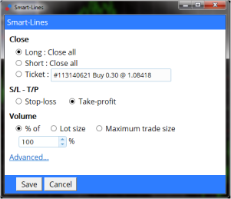
Hold down the Alt key while clicking on the line
A window such as the following will then pop up, letting you choose what action the line should take:
5.3.1Horizontal lines and trend-lines
Horizontal lines and trend-lines create a price-based stop or take-profit, i.e. an instruction to close part or all of some positions when the price touches the line.
You can apply horizontal and trend-lines to all buy orders, or to all sell orders, or to any selection of orders of the same type. (For example, if you have 5 open buy orders and 5 open sell orders, then you could select any 2 buy orders or any 4 sell orders from the drop-down list, but you cannot choose a mixture of buys and sells.)
A horizontal line or trend-line must also be either a stop-loss or a take-profit. When you create the Smart Line, the price must be valid as your selection of stop-loss or take-profit. For example, if a line is below the current market price then it cannot be used as a take-profit on a buy order.
5.3.2Vertical lines
Vertical lines create a time-based stop, i.e. an instruction to close part or all of some positions at a fixed time in the future (regardless of price).
Because they are not price-based, vertical lines can be applied to any selection of orders without restriction.
5.4Volume to close
The volume to close when a line is hit can be defined in three ways:
A percentage of the order/position size
A fixed amount to close
A fixed minimum amount to leave open
5.4.1Percentage close
A percentage close is applied to the current order/position size. For example, if you have two lines at different prices which are each set to close 50%, then they will leave 25% of the original order still open. For example: the order is for 1.00 lots. The first line will close 50% of this, leaving 0.50 lots. The second line will close 50% of the 0.50, leaving 0.25 lots.
Please note that the Smart Lines always round up, on the basis that it is less risky to be out of the market than in it. For example: your order/position is 0.50 lots; the line is configured to close 25%; and the broker's minimum trade size is 0.10 lots. 25% of 0.50 is 0.125 lots. This will be rounded up to 0.20 rather than rounded down to 0.10.
5.4.2Fixed amount to close
Selecting a fixed amount to close simply closes that number of lots, or the current order/position size if smaller. For example, the line is instructed to close 0.50 lots. If the order/position is 0.75 lots then 0.50 will be closed, leaving 0.25. If the order/position is 0.10, then the entire 0.10 will be closed (and no further action will be taken).
5.4.3Fixed amount to leave open
The fixed amount to leave open is a way of saying "make sure that the order/position is no larger than X". For example, the line is instructed to leave 0.20 lots open. If the order/position is 0.10 lots when the line is hit, then no action will be taken. If the order/position were 0.50 lots, then 0.30 lots would be closed, leaving 0.20 lots.
5.4.4All-orders when closing
If you select one of the all-order options (e.g. all long orders) then the standard behaviour of the Smart Lines is to apply the amount to close to the total aggregate position. For example, you have 3 buy orders totaling 1.00 lots, for 0.50, 0.30 and 0.20 lots individually. If you tell the Smart Lines to close 60% then this will reduce the position size by 0.60 lots overall, on a FIFO basis. It will close the entire 0.50 order, plus a partial close of 0.10 from the 0.30. It will not close 60% of each individual order.
You can change this behaviour using the Advanced options, telling the Smart Lines to apply the rule to each order individually.
5.5.1Deleting pending orders
By default, the Smart Lines will only process open positions. However, you can use the advanced options to tell the line to delete pending orders as well. (A partial close of a pending order will delete the order and re-create a new order for a smaller amount.)
5.5.2Keeping lines after they are triggered
By default, lines are automatically deleted from the chart after they are triggered (i.e. when the price or time hits the line). However, you can choose to leave a line in place so that it continually applies in future, until you remove it manually. You can use this to create a rule such as "make sure I never have an open position if the price is more than X".
In order to be able to keep a line, it must have the following three characteristics:
It cannot be a vertical (time) line - for obvious reasons, this can only apply to horizontal or trend-lines.
It must apply to all-orders (or all buy orders etc) rather than to specific individual tickets.
The amount to close must be 100%. It cannot be a smaller percentage or a fixed lot size.
5.5.3Deleting a line if another line is triggered
You can choose to remove a line automatically if another line is triggered. For example, the current price is 1.2345, and you have a take-profit line at 1.2400 and a stop-loss line at 1.2300 which are each set to close 50% of your open position.
If you do not set a line to be removed when another line is triggered then the following can happen:
Price rises to 1.2400. 50% of the position is closed, e.g. closing 0.30 lots from a position of 0.60 lots.
Price then falls to 1.2300. A further 50% is closed, reducing the position from 0.30 lots to 0.15 lots.
5.5.4Closing orders individually
As described above, the default behavior of the Smart Lines is to apply its rules to the total aggregate positions when working on all orders, or all buy orders etc. You can change this behaviour using the advanced settings.
5.6Smart Lines filtering
If you select one of the all-order options, rather than specific individual tickets, then you can apply filtering to that list. In effect, you are then saying "all orders which meet the following conditions" rather than just "all orders".
You can filter on profit, lot size, order comment, and order magic number. For example, by changing the profit range to -9999999 to 0, you instruct the Smart Lines only to close any losing positions, and not to touch any winning positions.
The order comment and magic number conditions can be comma-separated lists of values. For example: 1234,2345,6789 tells the Smart Lines to close orders if their magic number is any out of 1234 or 2345 or 6789. Comment filters must match the start of the MT4 order comment, and are not case-sensitive.
6Multiple timeframes
You can view multiple timeframes for the Simulator using offline charts in MT4. For example: you can set the MT4 strategy tester to do a simulation on H1 data, but also create simulated charts for M5 and D1.
6.1Configuring which timeframes to create
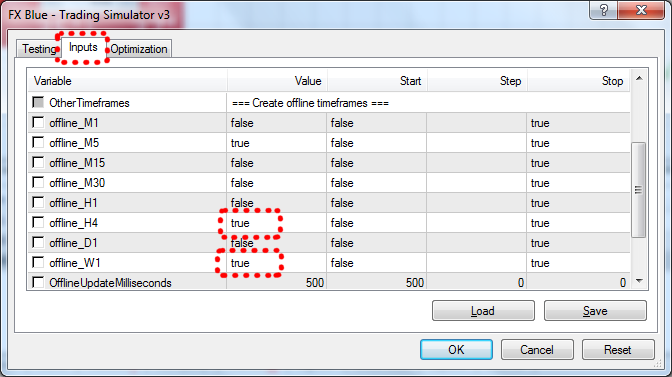
You tell the Simulator which extra timeframes to create using the options under the Expert Properties button in the MT4 strategy tester.
The list of settings includes options such as offline_M1 and offline_D1. You simply turn on the extra timeframes which you want. Please note that each extra timeframe will slightly reduce the Simulator's speed.
6.2Opening the offline charts
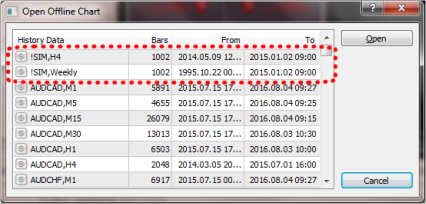
Once the Simulator is running, the extra timeframes are available as offline charts in MT4. You can open the charts using File / Open Offline, which will display a list such as the following. The extra charts created by the Simulator are listed as entries such as !SIM,H4:
Once you open one of the offline charts you can add indicators to it in the usual way, and the charts updates and pauses in line with the main simulated chart.
7.1Settings, and non-hedging mode
You can control the settings used by the Simulator by clicking on the Tools button () and choosing "Settings". This lets you turn on confirmations before orders are opened and closed, and also lets you turn on non-hedging mode.
By default, the Simulator follows normal MT4 behaviour and lets you have buy and sell orders open at the same time. (Please note that the MT4 strategy tester allows this even if you are using a US broker who is prohibited from allowing hedging.) If you turn on non-hedging mode, buy orders close sell orders, and vice versa. For example, if you are long 0.10 lots and place a sell order for 0.30 lots, then the buy order will be closed and a sell order will be placed for the balance of 0.20 lots.
7.2Automated tasks
You can see a list of all the automated tasks which the Simulator is running: any trailing stops on orders, plus any OCO orders. You click on the Tools button () and choose "Auto tasks".
7.3Undocking the Simulator window
You can undock the simulator into a floating window by clicking on the Tools button () and choosing "Undock terminal". You can continue to trade while the terminal is undocked from its chart. To re-dock the terminal, click on the Tools button again and choose "Re-dock terminal"
7.4Keyboard shortcuts
You can use the following keyboard shortcuts in the Simulator:
Alt+P: pauses the Simulator
Alt+]: increases the speed of the backtesting (equivalent to moving the slider in MT4's settings)
Alt+[: reduces the speed of the backtesting
Ctrl+Alt+B: places a buy order using the current volume, s/l, and t/p settings
Ctrl+Alt+S: places a sell order using the current volume, s/l, and t/p settings
Ctrl+Alt+C: closes all open positions and pending orders
The Simulator must have the current input focus for these shortcuts to work; the most recent mouse click must have been inside the Simulator's window (rather than elsewhere inside the MT4 software).
8.1Monitoring results while the simulation is running
You can monitor your results while the simulation is running either by using the Account info, or by using the Results and Graph tabs of the MT4 strategy tester.
8.2Viewing and analysing final results
At the end of the simulation - when it reaches the end of the selected period, or you terminate it early using the "Stop" button in the MT4 strategy tester - MT4 will compile its usual backtesting report on the Report tab.
The Simulator will also show your final net profit. You can then get more comprehensive analysis of your simulated trading by publishing the results to the FX Blue website. You simply click on the "Analyse trading" button, and the simulated history is uploaded to the website, giving you access to the full range of FX Blue reporting and analysis.
Please note: if you already use FX Blue to publish your live trading results, you may want to create a second account for use with the Simulator so that publication of the simulated results does not overwrite your live results. If you need to change account at the end of the simulation, click on the button and then log in again using a different FX Blue account.
9.1.1The visual-mode option is not visible
If the visual-mode option in the MT4 backtesting settings is not visible, then you simply need to increase the size of the backtesting pane: http://forum.mql4.com/70724
9.1.2Backtesting terminates immediately
If backtesting terminates immediately - i.e. the Stop button changes immediately back to Start - then please check for errors recorded by MT4 in the Journal tab in the strategy tester. The most likely explanation is that MT4 is unable to collect history data from your broker for the selected dates.
9.1.3The Simulator is not visible (blank, white window)
If the Simulator starts, but continues to display a blank white window even after waiting for a few seconds, then please check your settings for Internet Explorer (regardless of which browser you normally use for your web browsing). Something in the Windows settings for Internet Explorer is preventing it from displaying and running web content.
9.1.4Backtesting terminates after placing the first trade
If the backtesting/simulation is terminated immediately after you place the first trade, please look for errors in the Journal tab of the strategy tester.
The only known cause of this problem is the message from MT4 saying "margin exchange rate cannot be calculated", as a result of the deposit currency for the strategy tester being different to the deposit currency of your account.
Please check that the deposit currency which is being used in the strategy tester is correct, using the "Expert properties" button in the MT4 strategy tester pane. For another example and more information about this problem in the MT4 strategy tester, please see http://forum.mql4.com/34736
9.2Historic data, "unmatched data errors", modelling quality etc.
For general information about use of the MetaTrader 4 strategy tester, please see the MetaQuotes forum.mql4.com discussion board and articles. For example:
9.3"Multi-timeframe" (MTF) indicators
Please note that "multi-timeframe" indicators (those which display values for timeframes other than the chart they are running on) can effectively see into the future when used in visual-mode MT4 backtesting. They will potentially give you advantageous information which you could not have had historically. For example, halfway through a bar they will tend to indicate what is about to happen based on the future price at the end of the bar.
The technical reasons for this are as follows:
- If an EA uses MQ4 functions such as iClose(), iHigh(), iCustom() etc in backtesting for a timeframe which is different to the chart timeframe (e.g. the H1 values when running on a M15 chart), then this is safe. The values which the EA sees are based on the latest simulated price, not any future prices.
- But if an indicator is added manually to a visual-mode backtest, then use of iClose(), iHigh(), iCustom() etc for a higher timeframe will see the bar-end values rather than the interim simulated values. In other words, if an indicator is manually added to the chart, and collects prices from a higher timeframe than its chart, then it "breaks out" of the backtesting environment and can see what happens in the future.