Tick charts
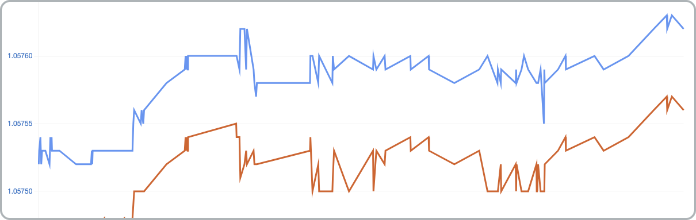
Live tick charts showing every change in the ask or bid price.
The tick chart shows you short-term market movements to support high-frequency trading, and lets you visualize changes in the spread. The charts can also show a tick speed indicator, illustrating active and quiet periods in the market, and can draw tick candles instead of a line chart.
Features
- Tick-speed histogram, showing the time taken for the last N ticks
- Timed mode, where the X axis of the chart has constant units of time while still showing each individual tick
- Option to draw tick candles (a chart where each candle is made up of e.g. 20 ticks, rather than being time-based)
Markets
FX Majors
FX Minors
Metals
Stock indices
Commodities
Cryptocurrencies
The terms and conditions of use set out below (referred to as "FX Blue's Terms"), form a contractual agreement governing FX Blue's relationship with you in relation to your use of this Website (“Agreement”) and you agree to be legally bound by FX Blue's Terms just as if you had signed this Agreement. By using this Website and any Information, you are agreeing to comply with and be bound by FX Blue's Terms, including any revisions that may be made to FX Blue's Terms from time to time. FX Blue reserves the right, in FX Blue's sole discretion, to change, modify, add or remove portions of FX Blue's Terms at any time by posting the revisions on the Website. You should check FX Blue's Terms periodically for changes as by using the Website after FX Blue posts any changes to FX Blue's Terms, you are agreeing to accept those changes, whether or not you have reviewed them, and you waive any right you may have to receive individualised notice of such changes. FX Blue's Terms may be supplemented by additional terms and conditions pertaining to specific content and activities. You agree and understand that such additional terms and conditions are hereby incorporated by reference to FX Blue's Terms. Your continued use of the Website means that you accept any new or modified FX Blue Terms.