 For a PDF version of this user guide, please contact us
1Widget overview
This document describes the premium website widgets which are available for brokers (and other premium users) running competitions using www.fxblue.com technology. These widgets are not available to people running free peer-to-peer competitions through FX Blue.
All the widgets are HTML5 components which can be included in your own web pages using simple iframes. You can also open the URLs in pop-up browser windows, send the URLs as links in email to participants etc.
The widgets are responsive to any screen/container dimensions, including mobile devices and tablets. All the widgets are available over either http or https. (The example URLs in this document use http, but you can replace this with https).
You can even respond to events within the widgets, linking them together e.g. so that your page displays a chart of the history for a participant when someone clicks on a name in a leaderboard.
The facilities available to premium users also include a CORS-friendly JSON feed which you can use to build your own widgets hosted on your own server, and an XML feed designed for back-office use such as data import into Microsoft Excel.
1.1Clicks on participant names or chart lines
All the widgets generate messages when a user clicks on the name or chart-line for a participant. You can use these messages to link the widgets together in ways such as the following: display a full leaderboard grid and pop-up a chart of that person's history when the user clicks on a name in the grid.
The widgets send you the message using the standard Javascript postMessage(). The data which they post is simply PARTICIPANTCLICK:username
You can see an example HTML page for handling these messages in the appendix below.
1.2Adding bespoke CSS and Javascript into the widgets
You can inject bespoke CSS and Javascript into the widgets using &css and &js parameters in the URL for a widget. These options are most useful in order to add extra bespoke styling to the mini leaderboard, but can be used with any of the widgets apart from the FX Blue result analysis.
For example, you can reference an external CSS file hosted on your own servers using a URL such as the following:
(The value of the CSS parameter ought to be URL-encoded, with / characters replaced by %2F etc, but modern web browsers do not actually insist on this.)
By prior arrangement, FX Blue Labs can host bespoke CSS or Javascript for you, making URLs simpler, and slightly improving the total load-time of your widgets.
1.3"Vanity" domains
The widgets cannot be hosted from your servers, because they require access to the data held by FX Blue Labs. However, by prior arrangement, it is possible to set up a "vanity" domain such as contest.mybroker.com. Any URLs which are publicly visible to participants then appear to be on your servers rather than ours. For example:
https://contest.mybrokerage.com/competitions/widgets/ch_leaders.aspx?id=477
In order to set this up, two things need to happen:
You need to create a CNAME record in your DNS, pointing the name such as contest.mybroker.com at FX Blue's servers. FX Blue will confirm what to use as the target of the CNAME.
FX Blue will then need to make server changes to accept this new traffic.
Please note that you will not be able to use https with such URLs (unless you buy a certificate for the name such as contest.mybroker.com and give it to FX Blue).
In many cases, it will be simpler, cheaper, and just as effective for you just to create a web page on your site which hosts a widget in a full-page iframe. Please see the appendix below for an example.
2.1Chart overview and standard options
All the charts are HTML5 components which automatically resize to fit whatever container you give them. The URL for the chart must always include the id= parameter for your competition. For example:
https://www.fxblue.com/competitions/widgets/ch_leaders.aspx?id=477
All the charts can then, optionally, be given further parameters in their URL. These fall into two categories:
Standard parameters which are accepted by all the charts, for controlling content (e.g. &count) or for altering cosmetics (e.g. &clr1)
Extra parameters which are specific to individual charts.
As a result, the URL for a chart can be a combination of standard and extra parameters such as the following:
(Reserved characters such as # should be encoded in the usual way for URLs, e.g. as %23).
2.1.1Included participants: the &count and &include standard parameters
All the charts can be configured to display any of the following:
The current top N participants (ranked by growth)
Selected, specific users
A mixture of both
The &count= parameter specifies how many of the top participants to include. The &include= parameter specifies a comma-separated list of additional users. For example, the following combination would include the current top 5 participants plus two extra people with the usernames "basil" and "jane".
&count=5&include=basil,jane
The &include parameter always defaults to blank. The &count parameter usually defaults to 10.
These parameters can substantially change the meaning of charts. For example, the main purpose of the Leaders chart is to show a leaderboard, but it can be modified using these parameters instead to display the results for any single person, or the head-to-head between two or more people etc. For example:
Example | Meaning |
&count=10 | Simple leaderboard of top 10 participants |
&count=0&include=bob | Show only "bob" |
&count=0&include=bob,sarah | Show head-to-head for "bob" and "sarah" |
&count=1&include=bob | Show "bob" versus the current leader |
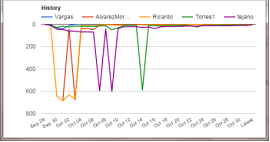
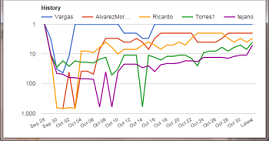
2.1.2Log-scale
All the charts provide an option for their values to be plotted on a logarithmic scale rather than a normal scale. This can be helpful when showing participants with wide variation in equity or growth, but is particularly useful in relation to charts involving rankings. The log-scale can be turned on by setting the &logscale parameter to any non-blank value:
&logscale=yes
For example, the following charts show historic rankings of current leaders. Using the chart on the left, it is impossible to see the recent jockeying within the top 5 because the changes are too small in relation to the largest ranking value (600+) displayed on the chart. In the second example, with the log-scale turned on, the extremes are "compressed" but the finer-grained movements become visible:
2.1.3Chart titles
You can change three titles associated with each chart: the main title at the top, and the titles for the x-axis and y-axis. The parameters for these are &title, &xaxistitle, and &yaxistitle. For example:
&title=Current%20leaders&xaxistitle=Return%so%far
To turn off a title, set its value to a space (encoded as %20 in a URL):
&title=%20
2.1.4Line/bar colours
You can specify up to 20 chart colours using the parameters &clr1, &clr2 etc. The values can either be HTML colour codes such as "Goldenrod", or hexadecimal codes such as "#CCFFFF" (with the reserved # character encoded as %23 in a URL). For example:
&clr1=red&clr2=%23008000
The way in which colours are used depends on the chart. For example, the ch_leaders chart uses colour 1 for participants above zero (or above the baseline, if you change it) and colour 2 for participants below it.
2.1.5Background and text colours
You can change the colour of the chart background and text using the &bgcolour and &textcolour parameters. For example, the following setting changes the colour scheme to white text on a black background:
&bgcolour=black&textcolour=white
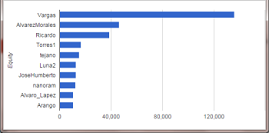
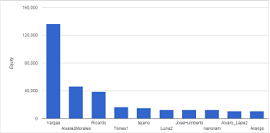
2.2ch_leaders
https://www.fxblue.com/competitions/widgets/ch_leaders.aspx?id=X
The ch_leaders chart displays a bar chart of the current equity or % return of selected participants. Via the &count and &include parameters, it can be used to display any of the following:
A leaderboard of the top N participants
The current status of a single user
Head-to-head current position between any number of selected users
One or more selected users versus the current leader (or current top 3 etc)
https://www.fxblue.com/competitions/widgets/ch_leaders.aspx?id=477
2.2.1&mode parameter
You can configure the ch_leaders chart to display either the return % or equity (the default). The corresponding values for &mode are "return" and "equity".
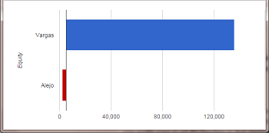
2.2.2&baseline parameter
You can move the chart's baseline from zero to another value using the &baseline parameter. For example, in a normal competition where all the participants started on the same equity, you might want to set the baseline to that starting value, highlighting the difference between profitable and unprofitable contestants:
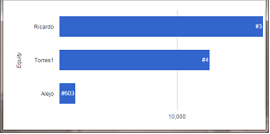
2.2.3&showrank parameter
The &showrank parameter adds the participant's current ranking as a note into the bar for that person. To turn it on, you simply set &showrank to any non-blank value such as &showrank=yes or &showrank=1.
2.2.4&style parameter
Although the most natural way to display a list of participants is a bar chart, as illustrated in the examples above, you can use the &style parameter to change the chart to a column chart or line chart instead:
&style=column
&style=line
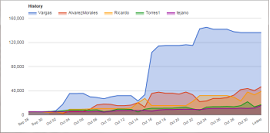
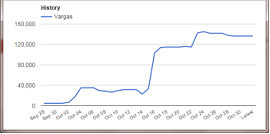
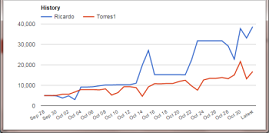
2.3ch_history
https://www.fxblue.com/competitions/widgets/ch_history.aspx?id=X
The ch_history chart displays the history of participants' equity, or return %, or ranking. Via the &count and &include parameters, it can be used to display the track record of an individual participant, the head-to-head between multiple participants, the history of the current leaders etc.
2.3.1&style parameter
By default the history is shown as a simple line chart. However, you can change this to an area chart using the &style parameter: &style=area
https://www.fxblue.com/competitions/widgets/ch_history.aspx?id=477&style=area
2.3.2&mode parameter
The &mode parameter controls whether the history shows the equity of the selected participants, or return %, or ranking. The corresponding values for the parameter are "equity", "return" and "rank".
2.3.3&start and &end parameters
You can set start and end dates for the history chart using the &start and &end parameters. If present, these should be specified as dates in the format yyyy-mm-dd. For example:
&start=2015-07-21
If you include the &end parameter then the chart will not include the current, latest values for each competitor, even if the &end date is in the future.
2.3.4&hourly parameter
By default the history chart shows daily data points. However, the competition mechanism records hourly snapshots for each person, and you can switch to this more detailed view using the &hourly parameter. You turn this on by setting &hourly to any non-blank value such as &hourly=yes or &hourly=1
2.3.5Note on colours with ch_history
Instead of using the defaults, you can set the colours for each participant's line in the history chart using the standard &clr parameters.
However, if you do specify your own colours then the widget will only use the colours which you give it. If you only list one colour, then that colour will be used for all the participant lines. If you list 2 colours, and there are 10 participants, then the 2 colours will be used in rotation. If you want different colours for each participant but you want to change some of the default colours, then you need to re-specify all the colours.
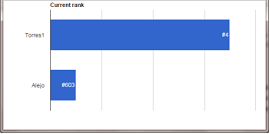
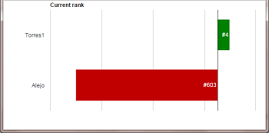
2.4ch_currentrank
https://www.fxblue.com/competitions/widgets/ch_currentrank.aspx?id=X
The ch_currentrank chart shows the comparative rankings for selected participants. It is similar to the ch_leaders chart, but the length of the bar on the x-axis is each person's ranking rather than their equity or return %. (An alternative to ch_currentrank is to use ch_leaders, showing either the equity or the return % for each selected person, and turning on the ranking annotations using the &showrank parameter.)
By default, the &count parameter for ch_currentrank is 1. If you use no other parameters then it will simply show the current competition leader with a "#1" next to their name. You can show any other participant against the leader using the &include parameter. The following examples have the same effect:
&include=anotherperson
&include=anotherperson&count=1
To show only selected participant(s), and not the current leader, you would use something like the following:
&include=anotherperson,andanother&count=0
2.4.1&baseline parameter
You can use the &baseline parameter to move the dividing line for the x-axis. For example, with &baseline=50, participants in the top 50 are shown as bars pointing to the right, and participants outside the top 50 are shown as bars pointing to the left.
2.4.2&style parameter
You can use the &style parameter to change the chart to a column chart or line chart instead of a bar chart:
&style=column
&style=line
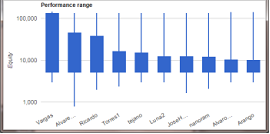
2.5ch_range
https://www.fxblue.com/competitions/widgets/ch_range.aspx?id=X
The ch_range chart shows the performance range of competitors during the competition, as a series of trading-style candles with an open, high, low, and close. The open is the starting equity (or growth); the close is the participant's current status. The high and low are the peak and trough which they have reached during the competition so far.
In the following example, all the top 10 participants have reached a similar peak during the competition, but only the current leader has come close to sustaining that peak. The person currently in 2nd is notable for having recovered from a serious trough.
2.5.1&mode parameter
The ch_range chart can either show equity or growth - not return %, because the return can be negative, and negative values cannot be represented on a candle chart. Instead, growth of 1 is equivalent to zero return; growth of 2 is equivalent to a 100% increase etc. The corresponding values for the &mode parameter are "growth" and "equity".
3Mini auto-refreshing leaderboard
https://www.fxblue.com/competitions/widgets/tbl_leaders.aspx?id=X
The tbl_leaders widget shows an auto-refreshing mini leaderboard. The widget automatically resizes to fit whatever width of container you give it. If the number of participants who you choose to include is then too large for the height of your container, you can choose whether the overflow is hidden or whether the widget displays a vertical scrollbar.
The URL for the chart must always include the id= parameter for your competition. For example:
https://www.fxblue.com/competitions/widgets/tbl_leaders.aspx?id=477
The widget gives you a wide variety of options and control of its formatting via parameters in the URL. For example:
You can have column headers simply by putting those in your containing page, immediately above where you put the iframe for the leaderboard!
3.1Included participants: the &count and &include standard parameters
Like the charts, the mini leaderboard can have &count and &include parameters which control the participants who are displayed. Therefore, you can choose to show the following:
The current top N participants
Selected, specific users (e.g. a head-to-head between two or more people)
A mixture of both
The &count= parameter specifies how many of the top participants to include, and defaults to 10. The &include= parameter specifies a comma-separated list of additional users. For example, the following combination would include the current top 5 participants plus two extra people with the usernames "basil" and "jane".
&count=5&include=basil,jane
3.2&refresh parameter
The widget automatically auto-refreshes, every 60 seconds by default. You can change this period using the &refresh parameter, down to a minimum of 10 seconds (&refresh=10). If you want to turn off the auto-refresh, simply set the parameter to a very large value such as 99999.
3.3&mode parameter
You can choose whether the leaderboard shows equity, profit, or return % using the &mode parameter. The corresponding values are "equity", "profit" and "return", e.g. &mode=return
You may want to set different number formatting depending on the type of value you choose to display.
3.4Number formatting
You can control the formatting of the numbers in the leaderboard using the following options.
These options can be used with any of the modes, but it obviously only makes sense to use an option such as &percent when displaying percentage returns.
3.4.1&digits parameter
The &digits parameter controls the number of decimal places in the numeric value, e.g. &digits=0 to show whole numbers only.
3.4.2&thousep and &digsep parameters
You can change the decimal point and thousands-separator using the &digsep and &thousep parameters. For example, &thousep=, turns on a comma separator between thousands, displaying a number such as 123,456 instead of 123456. The following example uses common European styling with a , as the decimal separator and a . between thousands:
&digsep=,&thousep=.
3.4.3&plussign parameter
The &plussign parameter turns on a + symbol in front of positive numbers. This would typically be used in relation to return % (not equity), in order to display a positive return as +50% rather than just 50%. You turn on the signs by setting &plussign to any non-blank value, e.g. &plussign=yes
3.4.4&percent parameter
The &percent parameter turns on a % sign after numbers, displaying a value as 60% rather than just 60. You turn this on by setting &percent to any non-blank value, e.g. &percent=yes
3.4.5&currsym parameter
The &currsym parameter specifies a currency prefix. For example, if you use &currsym=$ then all numeric values will be displayed as $12345 instead of 12345 etc. The prefix does not have to be a single character:
&currsym=USD
&currsym=$%20 (i.e. a $ followed by a space, URL-encoded as %20)
3.4.6&colourcode parameter
The &colourcode parameter turns on colour-coding of the numeric values, displaying positive numbers in green and negative numbers in red. You turn this on by setting &colourcode to any non-blank value, e.g. &colourcode=yes
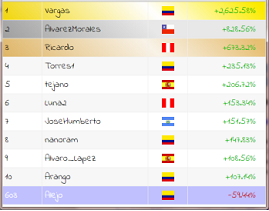
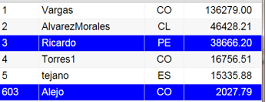
3.5.1&highlight parameter
You can highlight participants by setting the &highlight parameter to a comma-separated list of names. The following example displays the top 5 competitors plus an extra participant called "Alejo", and then highlights both Alejo and one of the leaders.
3.5.2&highlightbg and &highlightfc parameters
By default the highlighting of competitors is white text on a blue background. You can change this using the &highlightbg and &highlightfc parameters, which can be set either to an HTML colour code such as "red", or to a hexadecimal value prefaced in the usual way with # (and URL-encoded as %23). The following example displays highlights as dark red on a lighter red background:
&highlightbg=red&highlightfc=%23C00000
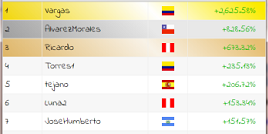
3.6&gsb and &gold parameters
You can turn on gold, silver and bronze colour-coding of the top 3 competitors using the &gsb parameter, setting it to any value such as &gsb=yes
Alternatively, you can turn on a gold highlight for the top competitor only (no silver or bronze) using &gold=yes
3.7Standard row colours: &oddbg, &oddfc, &evenbg, &evenfc
The standard row colours in the table - leaving aside highlighting and the gold/silver/bronze options - are an alternating white and light grey.
You can change the background and text colours for odd and even rows using the parameters &oddbg, &oddfc, &evenbg, and &evenfc. Each of these can be set to an HTML colour code such as "red" or to a hexadecimal value prefaced in the usual way with # (and URL-encoded as %23). The following example shows all rows as white text on a blue background, with no alternation of odd and even rows:
&evenbg=blue&evenfc=white&oddbg=blue&oddfc=white
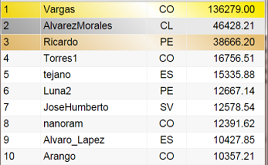
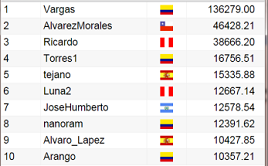
3.8&flags and &nocountry parameters
You can turn off the country column (making the name and value columns wider) using the &nocountry parameter, setting it to any non-blank value such as &nocountry=yes
Alternatively, you can display flags instead of country codes using the &flags parameter, again setting it to any non-blank value such as &flags=yes
3.9&nogridlines parameter
By default the leaderboard has grid lines around each cell of the table. You can turn these off using the &nogridlines parameter, setting it to any non-blank value such as &gridlines=yes
3.10&scroll parameter
The leaderboard automatically resizes to the width of the container which you give it, and does not display a vertical scrollbar if the content is then too long to fit the height of your container. You can turn on a vertical scrollbar using the &scroll parameter, setting it to any non-blank value such as &scroll=yes
3.11.1&gf parameter
You can change the typeface used in the leaderboard to anything which is available via Google Fonts. For example:
&gf=Roboto
&gf=Indie%20Flower
3.11.2&fontsize parameter
You can change the size of text in the leaderboard using the &fontsize parameter. You need to specify the units as well as the number. For example:
&fontsize=16px
&fontsize=10pt
Please note: by default the font size in the widget is defined in terms of viewport width (font-size: 4vw) so that the text expands to fit whatever container you give it. Unless you are always going to be displaying the widget in a fixed-size container, you may similarly want to make the text larger or smaller than the default by increasing or decreasing the definition in vw terms, e.g. &fontsize=3.8vw to make the text slightly smaller than the default.
3.12&namehyperlinks parameter
There is always a notification to the parent page if the user clicks on a participant name in the grid. However, by default, there is no styling on the leaderboard to indicate that the participant name is a hyperlink (potentially, if you choose to handle the notifications).
If you are using the post-message mechanism to process clicks on individual participants, and you want to make it more obvious that the participant name is a hyperlink, you can turn on the &namehyperlinks parameter by setting it to any non-blank value, e.g. &namehyperlinks=yes. This changes the mouse-over styling to indicate that each row is a link.
3.13Bespoke CSS additions
If you want to make further bespoke additions to the styling of the widget, you can inject your own hosted stylesheet into the page using the &css parameter.
The easiest way to establish how to make changes is to view the standard stylesheet at the following URL, and inspect the HTML of the rendered leaderboard using something such as "Inspect element" in Google Chrome.
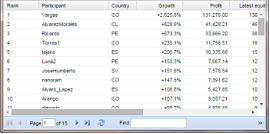
4Full leaderboard grid
https://www.fxblue.com/competitions/widgets/grid_leaderboard.aspx?id=X
The grid_leaderboard shows a paged grid of all participants in the competitions, with all the usual grid functionality:
Resizes to fit whatever container you give it
Sorting by clicking on column headers
Moving from page to page
Search box for finding a specific participant
The URL for the grid must always include the id= parameter for your competition. For example:
https://www.fxblue.com/competitions/widgets/grid_leaderboard.aspx?id=477
4.1&pagesize parameter
By default the grid shows 50 participants per page. You can alter this using the &pagesize parameter, e.g. &pagesize=20
4.2&nosearchbar parameter
You can turn off the search bar at the bottom of the grid using the &nosearchbar parameter. Giving this any non-blank value, e.g. &nosearchbar=yes, turns off the field.
4.3Column parameters
You can control the columns in the grid using separate parameters for each column such as &col3hide=yes. The default columns in the grid are as follows, and you reference them in parameters such as &colNhide by using the numbers shown below:
1 | Rank |
2 | Participant name |
3 | Country |
4 | Current return % |
5 | Profit |
6 | Latest equity |
7 | Start equity |
8 | Peak equity |
9 | Trough equity |
10 | Peak loss % |
4.3.1&colNhide parameter
You can hide a column in the grid by setting &colNhide to any non-blank value. For example, &col3hide=yes turns off the country column.
You can also hide multiple columns using the &colorder parameter for column-ordering.
4.3.2&colNwidth parameter
You can set the width of a column, in pixels, using the &colNwidth parameter. For example, &col2width=200 sets the width of the participant-name column to 200 pixels.
4.3.3&colNtitle parameter
You can change the text in the header of a column using the &colNtitle parameter. For example, &col4title=Growth changes the header text from "Return %" to "Growth".
4.3.4&colorder parameter
You can change the order of columns - and also hide them - using the &colorder parameter. If specified, this is a comma-separated list of the columns which you want to display, and the order in which they should appear. Any columns not mentioned on the list are hidden.
For example, &colorder=1,2,6,4 does the following:
Shows the columns in the order: rank, name, latest equity, return %
Hides all other columns
4.4&fontsize parameter
You can change the font size of the grid using the &fontsize parameter. This should be set to a normal CSS value in pixels, e.g. &fontsize=14
4.5&namehyperlinks parameter
There is always a notification to the parent page if the user clicks on a participant name in the grid. However, by default, there is no styling on the grid to indicate that the participant name is a hyperlink (potentially, if you choose to handle the notifications).
If you are using the post-message mechanism to process clicks on individual participants, and you want to make it more obvious that the participant name is a hyperlink, you can turn on the &namehyperlinks parameter by setting it to any non-blank value, e.g. &namehyperlinks=yes. This displays the participant names with standard <A> styling.
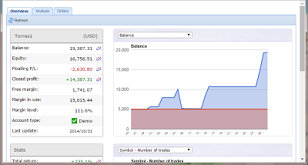
5Individual participant analysis
https://www.fxblue.com/competitions/widgets/view_participant.aspx?id=X&include=Y
The premium widgets give you access to the full FX Blue history analysis, but in widget form without the usual www.fxblue.com site navigation and advertising. Like all the widgets, this automatically adjusts to the size of the container which you give it.
https://www.fxblue.com/competitions/widgets/view_participant.aspx?id=477&include=torres1
5.1&include parameter
In addition to the ?id= competition parameter, you must also use the &include parameter to specify which participant you want to display analysis for.
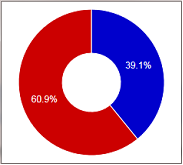
6Competition long/short sentiment chart
https://www.fxblue.com/competitions/widgets/ch_sentiment.aspx?id=X&symbol=Y
The ch_sentiment widget displays a pie chart of long/short sentiment for a particular instrument based on all participants' total current open positions for that instrument.
Please note: sentiment is not necessarily available for all competitions. It may require collection of the competition data via a specific route such as the MT4 Manager API. Please check with FX Blue Labs whether sentiment is available for your competition.
The URL which you use for the widget needs to include both the usual ?id= parameter for your competition and also a &symbol= parameter identifying the instrument for which you want the sentiment. Please note that this parameter will usually need to be the symbol name in your trading platform; it is potentially a value with a suffix such as EURUSD+ or EURUSDcx rather than a plain symbol name. For example:
https://www.fxblue.com/competitions/widgets/ch_sentiment.aspx?id=477&symbol=EURUSD%2E (i.e. EURUSD. with URL-encoding of the . character)
6.1&mode parameter
The optional &mode parameter determines which data values are used to calculate the long/short sentiment percentages. There are three options, with "net" being the default:
net | Number of traders who are net-long and net-short. Someone who has 5 open trades for a total of 0.80 lots counts the same as someone who has 1 open trade for 0.01 lots. A participant with "hedged" orders who is long 0.20 and short 0.40 would count as net-short. |
trades | Total number of open long and short trades. Someone who has 5 open long trades for 0.80 lots counts 5 times as much towards the figures as a trader who has a single open trade for the same volume. |
volume | Total long volume and short volume. |
6.2&style parameter
You can change the style of the pie chart between three different options, using the optional &style parameter:
pie | Standard pie chart |
3d | 3D pie chart |
doughnut | Pie chart with a hole in the middle |
6.3Colours
The ch_sentiment widget accepts all the same colour options as the participant charts: the &clr parameters for the segments of the pie, and the &bgcolour parameter for the chart background.
7Data
As well as using the pre-built widgets, you can collect the underlying data for the competition in either JSON or XML format.
Like the charts and mini leaderboard, these feeds accept &count and &include parameters specifying which participants to put into the feed. The default is the current top 10 leaders (i.e. defaults to &count=10). You can get a list of all competitors simply by setting &count to a very large number such as &count=99999. Alternatively, you can request data only for specific competitors using a URL such as the following:
7.1JSON feed
https://www.fxblue.com/competitions/widgets/_getcompetitorjson.aspx?id=X
The feed returns a JSON array of all the specified participants (the top 10, unless you explicitly set the &count or &include parameters). You can request the entire list of competitors simply by setting &count to a very large number.
This feed is CORS-friendly. You can use Javascript in web pages on your own site to collect data from www.fxblue.com without encountering cross-domain security problems.
7.2XML feed
https://www.fxblue.com/competitions/widgets/_getcompetitorxml.aspx?id=X&api=Y
N.B. The XML feed requires an API code (&api parameter) as well as the usual ?id= value identifying the competition. This is because the XML feed includes the sensitive information of the broker account number for each participant. FX Blue Labs will provide you with the API code for your competition.
The feed returns an XML list of all the specified participants (the top 10, unless you explicitly set the &count or &include parameters). You can request the entire list of competitors simply by setting &count to a very large number. For example:
https://www.fxblue.com/competitions/widgets/_getcompetitorxml.aspx?id=477&api=X&count=99999
It may be useful to note that the XML feed is an easy way of getting data into Microsoft Excel for analysis. You can quickly download the data and then use the standard filtering and pivot-table functionality of Excel in order to look at competitors who have not yet traded (current equity is the same as start equity), analyse performance by country etc.
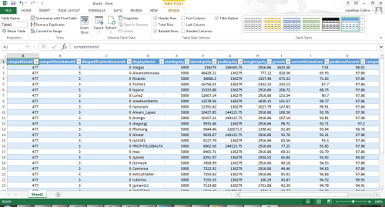
The exact steps depend on the version of Excel which you are using, but instructions for Excel 2013 are as follows:
Go to the Data tab
Click on the From Web button in the tool ribbon
Enter the URL for the feed
Click on Import (or Go). This will display a preview of the XML data.
Click on Import again
Ignore a pop-up message saying "…does not refer to a schema".
Choose where you want to put the data (by default, the currently selected cell in Excel)
Excel will then insert the data as a table, with column filtering automatically turned on.
You can then update the Excel spreadsheet with the latest competitor performance on the server simply by doing the following:
Right-click anywhere over the imported data
Choose XML / Refresh XML Data from the pop-up menu
8Bespoke development
FX Blue Labs are always happy to discuss bespoke development, either of further widgets or to assist in creation of extra facilities such as weekly emails generated from the competition data.
In many cases we will be prepared to do this work without additional charge if we believe that the new features are likely to be of benefit to other clients in the future.
For any requests or enquiries about further competition facilities, please contact us at the following email address:
Appendix A: Example of handling clicks on participants
The following simple HTML page shows an example of receiving messages from a widget when the user clicks on a chart object (or on a participant's name in a grid etc).
The page uses addEventListener() to watch for messages, and then parses the data coming in to see if it is a click-notification from a widget.
The page demonstrates receipt of clicks both from an iframe within the page itself and also from a widget which has been opened in a separate pop-up browser window.
<!doctype html>
<html>
	<head>
		<script type="text/javascript">
			// Opens the content of the iframe in a pop-up window
			function OpenNewWindow()
			{
				window.open(document.getElementById('ifr').src, "_blank", "width=500,height=400");
			}

			function OnLoad()
			{
				// Set up listening for events
				window.addEventListener("message", OnReceivePostedMessage);
			}

			function OnReceivePostedMessage(event)
			{
				// Check the data which has been posted to this window
				if (event.data.indexOf("PARTICIPANTCLICK:") == 0) {
					var ParticipantId = event.data.substr(17);

					alert("Click on " + ParticipantId);

				} else {
					// Some other message
				}
			}
		</script>
	</head>

	<body onload="OnLoad()">
		<input type="button" value="Open in new window" onclick="OpenNewWindow()"/>
		<br/>
		<iframe id="ifr" src="https://www.fxblue.com/competitions/widgets/ch_leaders.aspx?id=477"></iframe>
	</body>
</html>
The following more comprehensive example displays a full-page grid, with a chart for an individual participant displayed as a pop-up when you click on a name in the leader board:
<!doctype html>
<html>
	<head>
		<style type="text/css">
			HTML {width: 100%; height: 100%; padding: 0; margin: 0;}
			BODY {width: 100%; height: 100%; padding: 0; margin: 0; overflow: hidden;}

			/* Full page leaderboard */
			#Leaderboard {width: 100%; height: 100%; border: 0;}

			/* Modal overlay, containing individual chart for participant */
			.ModalOverlay {
				position: fixed; top: 0px; left: 0px; width: 100%; height:100%;
				z-index: 100;
				background: rgba(128, 128, 128, 0.5);
			}

			.ParticipantChart {
				position: relative;
				left: 20vw;
				top: 20vh;
				width: 60vw;
				height: 60vh;
				background: white;
			}
		</style>

		<script type="text/javascript">
			function OnLoad()
			{
				// Set up listening for events
				window.addEventListener("message", OnReceivePostedMessage);
			}

			function OnReceivePostedMessage(event)
			{
				// Check the data which has been posted to this window
				if (event.data.indexOf("PARTICIPANTCLICK:") == 0) {
					// Click on a participant name.
					var strParticipantId = event.data.substr(17);

					// Create a whole-page modal overlay, with an onclick which destroys the overlay
					var divOverlay = document.createElement("DIV");
					divOverlay.className = "ModalOverlay";
					divOverlay.onclick = function(event) {event.target.parentNode.removeChild(event.target);};

					// Create a chart for the individual participant inside the overlay
					var divParticipantChart = document.createElement("IFRAME");
					divParticipantChart.src = "https://www.fxblue.com/competitions/widgets/ch_history.aspx?id=X&count=0&include=" + encodeURIComponent(strParticipantId);
					divParticipantChart.className = "ParticipantChart";

					// Append the chart to the overlay, and then append the overlay to the document.body
					divOverlay.appendChild(divParticipantChart);
					document.body.appendChild(divOverlay);
				} else {
					// Some other message
				}
			}
		</script>
	</head>

	<body onload="OnLoad()">
		<!-- Grid, with namehyperlinks turned on -->
		<iframe id="Leaderboard" src="https://www.fxblue.com/competitions/widgets/grid_leaderboard.aspx?id=X&namehyperlinks=yes"></iframe>
	</body>
</html>
Appendix B: full-page iframe
You may want to create pages on your web site which simply wrap competition widgets, so that you give/show participants a simple URL such as the following, on your own domain rather than FX Blue:
https://www.mybrokerage.com/contest/leaders
...instead of...
https://www.fxblue.com/competitions/widgets/tbl_leaders.aspx?id=477
An example of such a web page is as follows. The iframe automatically expands to fit the entire page, and the content within the frame also then automatically resizes.
<!doctype html>
<html style="width: 100%; height: 100%; margin: 0; padding: 0;">
	<head>
		<title>Leaderboard</title>
	</head>

	<body style="width: 100%; height: 100%; margin: 0; padding: 0; overflow: hidden;">
		<iframe src="https://www.fxblue.com/competitions/widgets/ch_leaders.aspx?id=477" style="border: 0; width: 100%; height: 100%;"></iframe>
	</body>
</html>