FX Blue Sentiment Indicator for MT5 - User guide
The Trader Sentiment Indicator lets you view FX Blue's trader sentiment within MT5, and compare the changes in sentiment to changes in price.
1Overview of the FX Blue Trader Sentiment indicator
1.1Purpose of the indicator
It displays the same data as the website at http://www.fxblue.com/connect/#sentiment but does so within the MT5 software as a custom indicator, allowing the trader sentiment to be compared against price action.
Please note:
- You need an FX Blue Live account in order to use the indicator. Your FX Blue username and password need to be entered as parameters for the indicator.
- The indicator gives you market insight; it does not issue buy or sell recommendations. Please see the section below about interpreting the indicator.
1.2Licence
Unless otherwise specified in writing by FX Blue.com, this software is licensed for personal use only. You are not allowed to distribute it to other people, regardless of whether or not money is changing hands.
The software is provided entirely at the user's risk, and you should check it thoroughly before deploying it on computers trading live money. FX Blue accepts no responsibility whatsoever for any loss of any kind caused by installation or use of the software.
2Installing the indicator
To install the indicator, run the setup program FXBlueTraderSentiment.exe
This will list the installations of MT5 on your computer, and you can choose which copies of MT5 to install the indicator into by clicking on them in the list. If you have any installations of MT5 which are not listed, you can add them using the "Find MT5" button.
After installation, you will need to restart any copies of MT5 which are already running. MT5's Navigator list does not update until MT5 is restarted.
3.1Chart symbol and timeframe
The indicator can currently be used on the following symbols: EURUSD, GBPUSD, USDJPY, USDCHF, AUDUSD, USDCAD, and EURCHF.
We recommend using the indicator on a short timeframe, e.g. M5 or even M1. The position can change very rapidly, particularly on EURUSD and GBPUSD.
You add the indicator to a chart in the usual way: either double-click on it in the MT5 Navigator in the Custom Indicators section, or drag it from the Navigator list onto a chart.
Please note that the "Allow DLL imports" setting must be turned on.
3.2What the indicator shows
The indicator can display the following statistics, matching the information shown on the FX Blue website at http://www.fxblue.com/connect/#sentiment:
- Dark green line: % of open positions which are long and in profit
- Light green line: % of open positions which are long and in loss
- Dark red line: % of open positions which are short and in profit
- Light red line: % of open positions which are short and in loss
- Blue line: total % of long positions (i.e. below 50 if most users are short, or above 50 if most users are long)
- Yellow histogram: % of FX Blue users with an open position in the symbol. This part of the indicator is turned off by default, and can be turned on using the parameters below.
On startup, the indicator will attempt to download a small amount of history for the symbol. It will then keep updating itself with the latest information from the website.
3.3Indicator parameters
N.B. You need an FX Blue Live account to use the indicator, and you must enter your FX Blue username and password as parameters for the indicator. (In future, use of the indicator may be restricted to people with active FX Blue accounts, i.e. people who are currently publishing their results to FX Blue Live.)
The other parameters can be used to control which parts of the indicator are displayed:
- ShowLongWin: turns on and off the % of long profitable positions (dark green line)
- ShowLongLoss: turns on and off the % of long losing positions (light green line)
- ShowShortWin: turns on and off the % of short profitable positions (dark red line)
- ShowShortLoss: turns on and off the % of short losing positions (light red line)
- ShowTotalLongShort: turns on and off the total long/short % (blue line).
- ShowPercentOfTraders: turns on and off the % of FX Blue live accounts with an open position in the symbol (yellow histogram).
You can change the colours of each part of the indicator in the usual way, using the Colors tab when adding it to the chart.
4.1Important note
The FX Blue Trader Sentiment is not a directional indicator. Interpreting the indicator is an art rather than a science. It should be used in conjunction with your other preferred indicators, plus analysis of news and market fundamentals.
4.2Notes about the indicator calculation
For a general explanation of the indicator, please see the following page of the FX Blue website:
4.3Examples
The following examples show a variety of relationships between the Trader Sentiment figures and price action.
To repeat: you should not rely on this indicator by itself. It can provide useful information, but only in conjunction with other indicators and data. In the first example below, the trigger for the market move is a major news event, and the indicator merely helps to confirm the direction implied by that news.
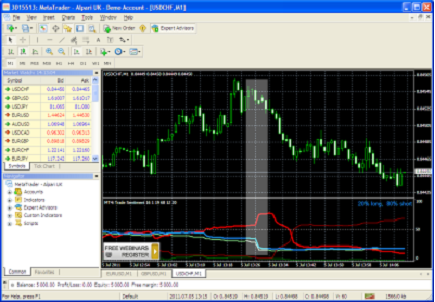
4.3.1USDCHF news event
In the following highlighted example, the percentage of people short USDCHF changed enormously over the course of a minute in response to breaking news about Greek debt restructuring.
The example also shows prior divergence, in that the percentage of long positions (blue line) had been declining in the run-up to the highlighted area, despite general upward movement in the price:
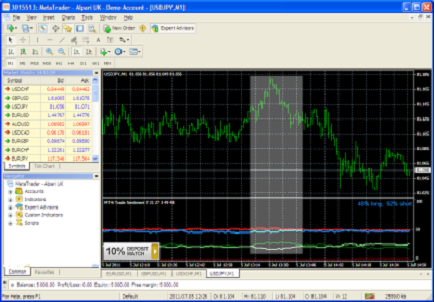
4.3.2USDJPY resistance
In the following example, USDJPY generally traded within a very narrow range (< 20 pips), and the number of long/short and winning/losing positions remained largely constant as a result. However, the highlighted area shows a period where the number of winning long positions began to move markedly above the number of losing long positions. This situation often leads to profit-taking, causing resistance (or, vice versa, support if short winning positions exceed short losing positions).
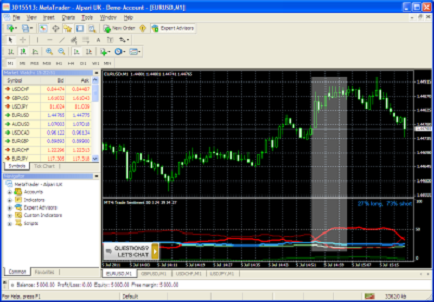
4.3.3Price/sentiment divergence
In the following example there was a rise in the price (causing the majority of open short positions to move from profit to loss). However, while the price then increased further in the highlighted area, the percentage of long positions decreased slightly (the blue line fell) rather than rising. This divergence suggested an area of resistance:
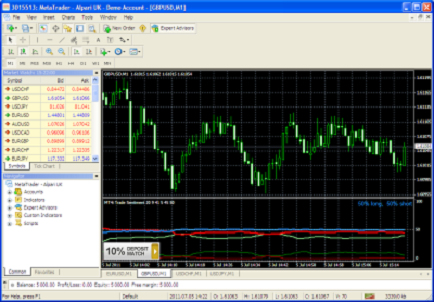
4.3.4Indecisiveness
In the following example, the market traded in a narrow range (25 pips). As a result, the various percentages remained largely unchanged, with a very large percentage of open positions in loss and waiting for a decisive market move. In addition, the total long/short percentage remained almost exactly at 50/50. In other words: market indecision!