FX Blue Trading Simulator for MT5 - User guide
The FX Blue Trading Simulator converts the MT5 Strategy Tester Visualization into a tool for practising manual trading using historic data. You can use the Simulator to test how well you would have fared under particular historic market conditions.
1Overview of the FX Blue Trading Simulator
1.1Purpose of the Trading Simulator
The FX Blue Trading Simulator converts the MetaTrader 5 strategy tester into a tool for practising manual trading using historic data. You can use the Simulator to test how well you would have fared under particular historic market conditions.
The Simulator lets you place market and pending orders, set trailing stops, alter the s/l and t/p on orders by clicking on the chart, save complex order definitions as templates, quickly close all open orders, plus many more features which are not available as standard in MetaTrader 5.
The results of a simulation can be published to the FX Blue website, giving you access to the full FX Blue reporting and analysis functionality.
1.1.1Current limitations of the MT5 Strategy Tester Visualization
Please note that the MT5 Strategy Tester Visualization currently has limitations compared to MT4. (However, it does have some facilities for multi-symbol simulations, which MT4 does not support at all.)
MT5's Strategy Tester Visualization window does not yet have any options for adding technical indicators to a chart, or for drawing objects such as lines, Fibonacci retracements etc.
MT4 visual-mode backtesting provides all the same features as trading on a live chart, whereas the MT5 visualization is currently much more limited. Therefore, you can use the MT5 Simulator to view historic prices and place historic trades, but you cannot add technical indicators or objects to the simulated chart.
If you want to use technical indicators in your simulation, you will need to use MT4 and our MT4 Trading Simulator until this functionality is added to MT5.
1.2Licence
Unless otherwise specified in writing by FX Blue, this software is licensed for personal use only. You are not allowed to distribute it to other people, regardless of whether or not money is changing hands. You only have a licence to use the software if you, personally, downloaded it from our website.
The software is provided entirely at the user's risk, and you should check it thoroughly before deploying it on computers trading real money. FX Blue accepts no responsibility whatsoever for any loss of any kind caused by installation or use of the software.
2.1Installing the Simulator
You install the Trading Simulator by running its setup program. This will list all the copies of MetaTrader 5 on your computer, and you simply click on the ones where you want to install the Simulator. If any copies of MT5 are not shown, you can add them to the list using the "Find MT5" button.
You will need to restart any copies of MT5 which are already running. MT5's Navigator list does not update until the software is restarted.
2.2MetaTrader 5 settings
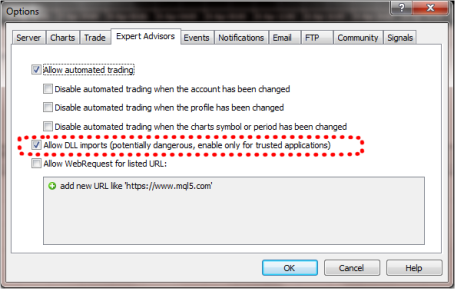
In order to use the Trading Simulator you need to turn on "Allow DLL imports". Click on Tools/Options in MT5, and then change the settings on the "Expert Advisors" tab as follows:
2.3FX Blue account
You need an account with FX Blue in order to use the Trading Simulator. You can create accounts for free at http://www.fxblue.com/live. The Trading Simulator can publish its results to the FX Blue website for further analysis. If you already use FX Blue to publish your live trading results, you may want to create a second account for use with the Simulator so that publication of the simulated results does not overwrite your live results.
3.1Starting the Simulator
You start the Trading Simulator by running a backtest in MT5 of the "FX Blue Trading Simulator" expert adviser:
- Open the MT5 strategy tester, by choosing "Strategy Tester" from the "View" menu, or by pressing Ctrl+R.
- Choose "FX Blue Trading Simulator" from the "Expert Advisor" list.
- Choose the symbol which you want to practise on from the "Symbol" list.
- Choose the chart timeframe which you want to practise on.
- Choose the date range which you want to practise on.
- Turn on the "Visualization" setting.
- Click on the "Start" button.
For example:

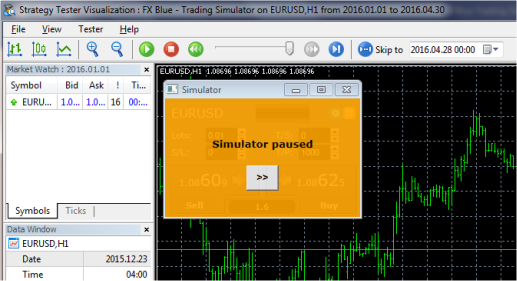
Once you click on "Start", MT5 will collect the historic data for your chosen dates, and then load its Strategy Tester Visualization in a new window, including the Trading Simulator. (If nothing happens when you click on "Start", please check the "Journal" tab of the strategy tester. The strategy tester will not run if it cannot collect historic data for your chosen dates.)
The first time that you use the Simulator, you will need to enter your FX Blue username and password. (These details are then remembered for re-use in future.)
When you are ready you can start the simulation using the button in the MT5 strategy tester or the equivalent button in the Simulator itself.
3.2Adding indicators to the chart
MT5's Strategy Tester Visualization does not yet provide this functionality, and therefore it is not available when using the Simulator. Please see the notes above.
3.3Controlling the speed of the Simulator
You can control the speed of the Simulator using the slider-control in the toolbar of the Strategy Tester Visualization.
3.4Pausing the Simulator automatically
You can make the Simulator pause after an s/l or t/p is hit, so that you can inspect the history of the trade before continuing. You turn on this option by clicking on the "Expert properties" button in the strategy tester and then altering the "Value" property for "PauseTester" on the "Inputs" tab.
The PauseTester setting has five options:
No pausing.
Pause when s/l or t/p is hit. The simulation will pause each time that a trade is closed at its s/l or t/p.
Pause after all trade closes. The simulation will pause each time that a trade closes for any reason, including trades which you close manually. This option will also pause if a pending order expires without being filled.
Pause at the start of each bar. The simulation will pause at the start of each and every new bar. (With this option, you may want to set the strategy tester to its maximum speed. You then decide at the start of each bar whether to place a trade, and resume the simulation as a way of skipping to the start of the next bar.)
Pause at the start of each bar, and also at each trade close. This is a combination of the two options above: the simulation pauses at the start of each bar, and also at any trade-closes in the middle of bars.
3.5Multi-symbol simulations
MT5's Strategy Tester Visualization currently has limited support for simulations involving multiple symbols (whereas MT4 has no such facilities at all). You can place orders on other symbols, but you cannot change the price chart to show one of the subsidiary symbols rather than the primary one.
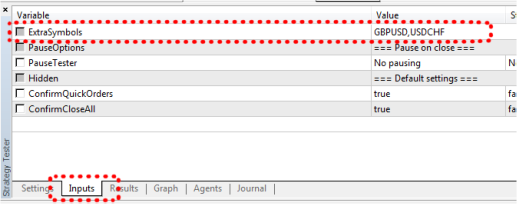
You can do a simulation using multiple symbols using the Inputs tab of the strategy tester pane. You set the ExtraSymbols parameter to a comma-separated list of the other symbols which you want to include:
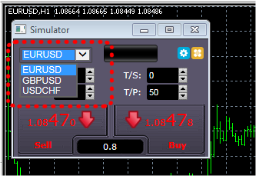
In the Simulator you can then switch between symbols using the drop-down list in the top-left corner:
Although you cannot change the price chart, and see the other symbols and their orders, you can nevertheless monitor and close the orders using the close-panel or the account info.
4.1Placing buy/sell orders
Once the simulation is running you can place buy and sell orders using the large green and red buy and sell buttons.
MT5 will show dotted horizontal lines for each order and also draw markers showing where orders were opened and closed. The status indicator at the top of the Simulator will show your current net position, e.g. +0.10 if you are long 0.1 lots, or -0.10 if you are short 0.1 lots.
You can control the lot size on new orders, and set a stop-loss, take-profit, or trailing-stop using the fields above the buy and sell buttons.
You can also open calculators for each of these fields by holding down the Ctrl key while clicking on them. For example, if you are trading 0.25 lots, and you want a stop-loss which is equivalent to $100, then you can Ctrl+click on the S/L field and tell the calculator to work out the number of pips which is equivalent to a fixed cash risk of $100.
4.2Placing pending orders
You can place pending orders (limits and stops) by clicking on the button. You can choose the order type and entry price, stop-loss, take-profit etc.
The entry price for pending orders can be defined either as a fixed price (e.g. 1.23456) or as a number of pips. For example, if you choose a buy-limit and enter a value of 20 pips rather than a price, then the limit order is created 20 pips below the current price.
4.2.1Placing pending orders from the chart
You can also create pending orders from the chart. If you hold down the Ctrl key while clicking on the chart, a small window will pop up letting you create a pending order at the selected price. If the price you click on is above the current price then you can create a buy-stop or a sell-limit; if the selected price is below the current price then you can create a buy-limit or a sell-stop.
4.2.2OCO orders
The new-order form also lets you place one-cancels-other (OCO) orders. There are two types of OCO order:
- "OCO breakout". You specify two prices, or two values in pips, either side of the current price, and the Simulator places a buy-stop and a sell-stop. Once one of the pending orders is filled, the other is automatically cancelled. You would typically use this when you are expecting a major price movement, but you don't know whether the move is going to be up or down. For example, there are many trading strategies based around trading the breakout, in either direction, of yesterday's range.
- "OCO reversion". In this case the Simulator places a buy-limit and sell-limit, rather than a buy-stop and sell-stop. You would typically use this if you are expecting a move in either direction followed by a return towards the current price - e.g. a bounce off yesterday's high or low.
4.3Order templates
If there is a type of order which you place regularly - e.g. a buy-limit 20 pips below the current price, with a 100-pip s/l and t/p - then you can save this as a template for quick re-use in future:
- Click on the button
- Enter the details of the order
- Click on the "Save template" button and choose a name.
You can then quickly execute that saved template in future:
- Hold down the Ctrl key while clicking on the button
- Choose the saved template from the list
4.4Closing and modifying orders
You can close all open and pending orders by clicking on the position marker at the top of the Simulator: the text which reads +0.10, -0.50 etc. This slides across an extra panel which shows the profitability of your open positions, and includes options for closing all your positions, reversing your position etc.
You can close individual orders by opening the account info - see below.
4.4.1Changing the s/l or t/p on open orders
You can change the s/l or t/p on all open orders by clicking on the chart. You move the mouse over the price where you want to set the s/l or t/p, and then hold down the Ctrl key while clicking - i.e. the same method as for placing a pending order.
From the window which pops up, you then click on the button for moving the s/l or t/p. For example, you can Ctrl+click on the high or low of a bar to set the s/l or t/p to that price.
4.5Account info
You can view information about your simulated account using the Account Info: click on the Tools button at the top of the Simulator and then choose "Account info".
This shows your total net profit in the simulation so far, your current balance and equity, the profit on all open orders, the margin usage etc.
The account info also shows a list of all pending and open orders. You can close each one of these by clicking on the icon next to its ticket number.
4.6.1Settings, and non-hedging mode
You can control the settings used by the Simulator by clicking on the Tools button at the top of the Simulator and choosing "Settings". This lets you turn on confirmations before orders are opened and closed.
4.6.2Automated tasks
You can see a list of all the automated tasks which the Simulator is running: any trailing stops on orders, plus any OCO orders. You click on the Tools button () and choose "Auto tasks".
4.6.3Undocking the Simulator window
You can undock the simulator into a floating window by clicking on the Tools button at the top of the Simulator and choosing "Undock terminal". You can continue to trade while the terminal is undocked from its chart. To re-dock the terminal, click on the Tools button again and choose "Re-dock terminal"
5.1Monitoring results while the simulation is running
You can monitor your results while the simulation is running either by using the Account info, or by using the Results and Graph tabs of the MT5 strategy tester.
5.2Viewing and analysing final results
At the end of the simulation the Simulator will show your final net profit. You can then get more comprehensive analysis of your simulated trading by publishing the results to the FX Blue website. You simply click on the "Analyse trading" button, and the simulated history is uploaded to the website, giving you access to the full range of FX Blue reporting and analysis.
Please note: if you already use FX Blue to publish your live trading results, you may want to create a second account for use with the Simulator so that publication of the simulated results does not overwrite your live results. If you need to change account at the end of the simulation, click on the button and then log in again using a different FX Blue account.