EUR/USD on track for its fourth straight day of gains
EUR/USD’s last few days’ advance has reached the February-to-March resistance line and 55-day simple moving average (SMA) at $1.0722 to $1.0725 which it is in the process of breaking through with last week’s high at $1.0760 representing the next upside target as the US dollar depreciates amid recent risk-off sentiment diminishing ahead of Wednesday’s FOMC meeting.
A rise above $1.0740 would engage the $1.0804 mid-February high, an advance above which would likely have medium-term bullish implications.
Slips should find support around the early March highs at $1.0694 to $1.0691, below which sits further support at the $1.0656 mid-February low.
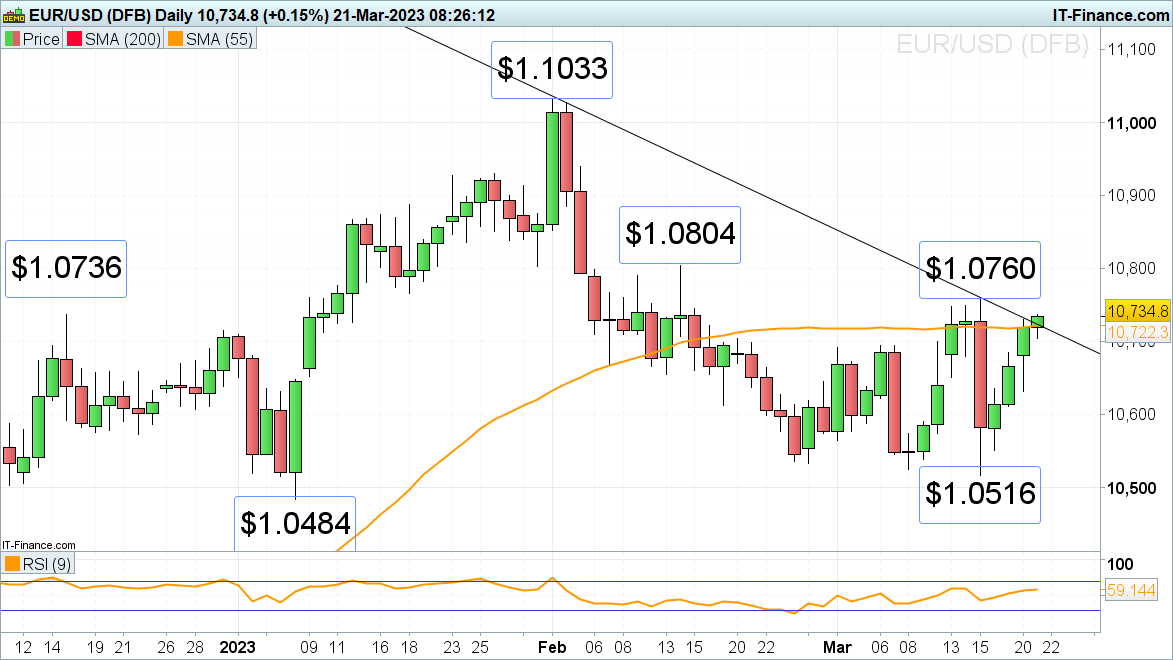 EUR/USD daily chartSource: Tradingview
EUR/GBP recovers ahead of German ZEW
EUR/GBP managed to hold its two-week descent as the European banking crisis seems to at least short-term abate and as market participants look to the German ZEW economic sentiment which is forecast to drop to 14.9 in March versus 28.1 in February.
EUR/GBP reversed slightly above its £0.8722 to £0.8719 support zone, consisting of the January and last week’s lows, and is fast approaching the March resistance line at $0.8772, a rise above which would bring the £0.8755 late February low and at Monday’s £0.8769 intraday high to the fore.
Were an unexpected bearish reversal to take the currency pair to below the £0.8722 to £0.8719 support area, the 200-day simple moving average (SMA) at £0.8686 would be in focus.
EUR/USD daily chartSource: Tradingview
EUR/GBP recovers ahead of German ZEW
EUR/GBP managed to hold its two-week descent as the European banking crisis seems to at least short-term abate and as market participants look to the German ZEW economic sentiment which is forecast to drop to 14.9 in March versus 28.1 in February.
EUR/GBP reversed slightly above its £0.8722 to £0.8719 support zone, consisting of the January and last week’s lows, and is fast approaching the March resistance line at $0.8772, a rise above which would bring the £0.8755 late February low and at Monday’s £0.8769 intraday high to the fore.
Were an unexpected bearish reversal to take the currency pair to below the £0.8722 to £0.8719 support area, the 200-day simple moving average (SMA) at £0.8686 would be in focus.
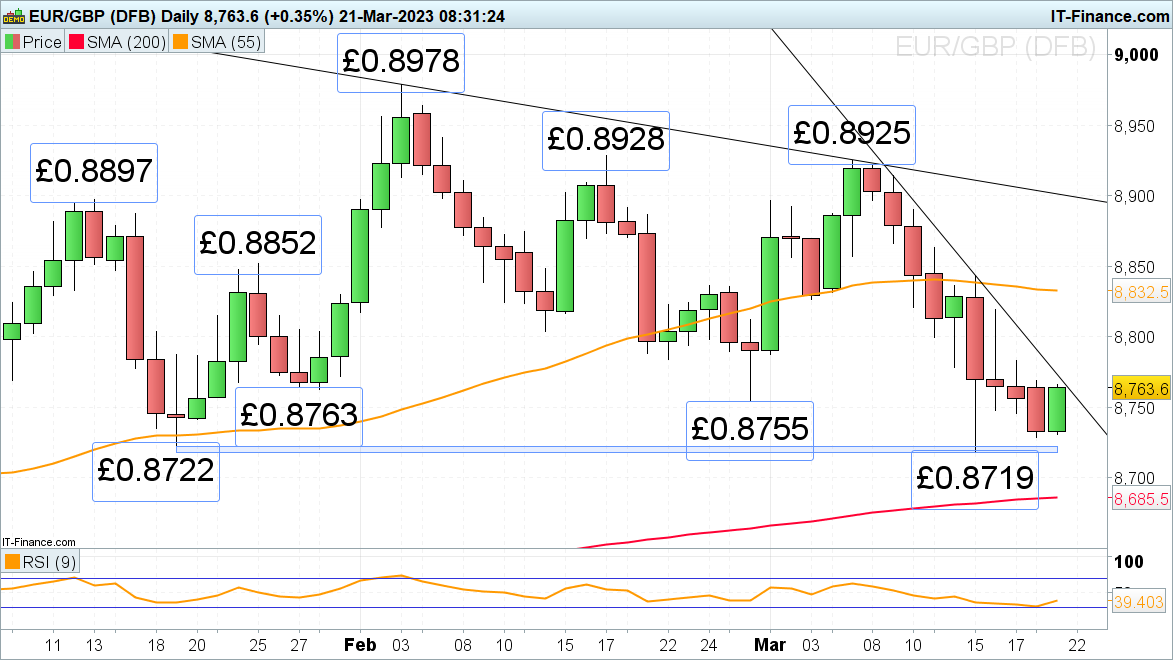 EUR/GBP daily chartSource: Tradingview
USD/CAD revisits mid-March low
USD/CAD continues to hover above its mid-March low at C$1.3652 amid falling oil prices and a weaker greenback ahead of Wednesday’s FOMC meeting in which the Federal Reserve (Fed) is expected to hike rates by 25-basis points to 4.75% to 5.00%.
A slip through C$1.3652 and the 38.2% Fibonacci retracement of the February-to-March advance at C$1.3634 would put the 50% retracement and the early March low at C$1.3563 to C$1.3556 on the map.
EUR/GBP daily chartSource: Tradingview
USD/CAD revisits mid-March low
USD/CAD continues to hover above its mid-March low at C$1.3652 amid falling oil prices and a weaker greenback ahead of Wednesday’s FOMC meeting in which the Federal Reserve (Fed) is expected to hike rates by 25-basis points to 4.75% to 5.00%.
A slip through C$1.3652 and the 38.2% Fibonacci retracement of the February-to-March advance at C$1.3634 would put the 50% retracement and the early March low at C$1.3563 to C$1.3556 on the map.
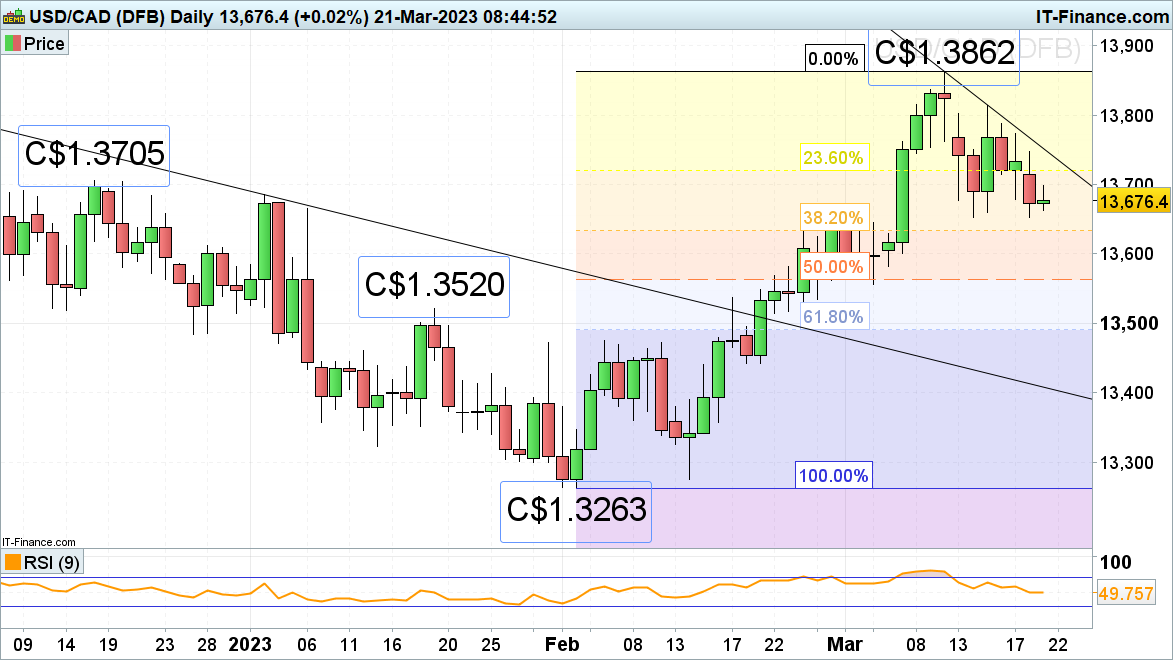 USD/CAD daily chartSource: Tradingview
 Disclaimer:
This information has been prepared by IG, a trading name of IG Markets Limited. In addition to the disclaimer below, the material on this page does not contain a record of our trading prices, or an offer of, or solicitation for, a transaction in any financial instrument. IG accepts no responsibility for any use that may be made of these comments and for any consequences that result. No representation or warranty is given as to the accuracy or completeness of this information. Consequently any person acting on it does so entirely at their own risk. Any research provided does not have regard to the specific investment objectives, financial situation and needs of any specific person who may receive it. It has not been prepared in accordance with legal requirements designed to promote the independence of investment research and as such is considered to be a marketing communication. Although we are not specifically constrained from dealing ahead of our recommendations we do not seek to take advantage of them before they are provided to our clients.
Publication date:
2023-03-21 13:05:51 (GMT)

 Challenges